Anyone with a website has likely used Google Analytics (GA) at some point.
It’s an industry heavyweight in the world of analytics and totally free. Nearly half of the top million websites around the world use it to grow their business.
Simply create an account and you’ll have access to actionable reports right out-of-the box.
Most people look at these reports to make critical business decisions every day.
This is selling yourself short. There’s no personalization or clear indication as to how data actually impacts your business in any way.
A high bounce rate isn’t always bad nor a high conversion rate inevitably good.
In this post, I’ll show you how to revamp your GA dashboard to uncover meaningful insight you can use to solve real challenges.
Where Traditional Google Analytics Falls Short
When you login to GA, a dashboard with the following ‘overview’ metrics is shown
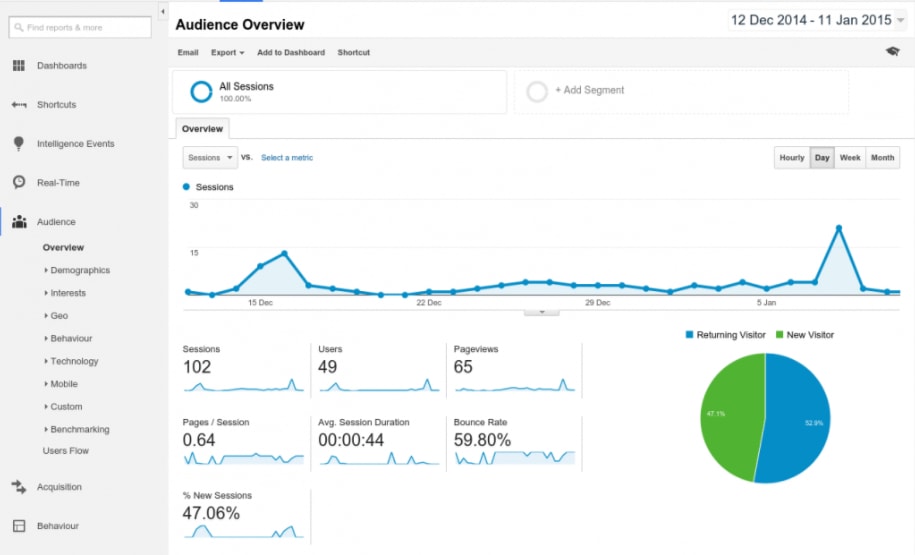
These data points are:
- Sessions
- Page views
- Bounce rate
- Conversion rate
There’s nothing wrong with these metrics by themselves. The problem stems from how GA measures a ‘session,’ which is then subsequently used to calculate all other data points.
A session is any interaction a user takes while on your page.
This could be anything from simple browsing, downloading files, or purchasing a product.
So what’s wrong with this picture?
Well, each GA session is defined by the following parameters:
- 30 minute time period
Each session or ‘visit’ is broken into 30-minute windows.
If someone spends 90 minutes on your site, GA will log that as 3 sessions. It doesn’t matter if the visitor remained inactive or watched a 20-minute video on and off.
- Change of day
Sessions are also automatically restarted at midnight every day.
If someone visits your page at 11:58 pm and doesn’t take action until 12:02 am, Google places that visitor in a new session at midnight.
You don’t have to be a rocket scientist to spot the flaw in this approach.
It leads to confusing data such as having more users than sessions.

Theoretically, this is impossible unless a session has 2-3 people sitting behind the screen being counted as users (which Google has no way of knowing).
This is problematic if you want to figure out how users interact with your pages.
Are people moving down the funnel after reading a super long landing page (even though it took them forever)? Or are they responding better to short, 2-3 minute videos?
Answering such questions based on the data presented here is clouded with uncertainty.
Besides not being able to confidently answer such critical questions, any shift in how a session is measured can drastically skew your numbers.
For example, let’s say your GA account is based on a server located in New York.
If most of your traffic comes from the West Coast in the late evening, some visitors will undoubtedly be counted twice in even less than 30 minutes.
What happens when you move your account server to California?
The number of sessions drops.
This means all your other data points will also change.
Naturally, you will react and make alterations to your website or campaigns despite there bring no real change behind the scenes. Traffic is still behaving the same as it was before.
Now, imagine if tomorrow Google announces that a session is defined as 60 minutes.
The same situation repeats itself.
This is why it’s critical to practice extreme caution when making decisions based on GA data.
The more sensible thing to do is convert GA into a tool that answers questions relevant to your business in order to accurately map user journey.
Instead of being puzzled by what “time on page” means, find a way to measure interactive time on page (how long a user is actually active on your page).
Combine this with other measurements like article length and scroll depth (how far down the page a visitor scrolls).
What you’ll end up with is an accurate and detailed representation of your content funnel.
We’ll see how you can do all of this a bit later with help from Google Tag Manager (GTM), custom tags, scripts, and schema data.
But first, it’s important to understand how we can manipulate GA’s existing framework.
Minimal GA Customization Can Reveal Insights
If you explore under the hood, GA has many opportunities for experimentation and tinkering.
Let’s say you’re a B2B firm trying to optimize the top end of your funnel. You want to figure out what an ‘ideal’ piece of content looks like.
Do readers prefer 1k word blog posts? Or are epic 5k word posts better?
Obviously, you don’t want to promote 1k blog posts if the bulk of your visitors and sign-ups come from a few 5k word posts.
When coming up with a content strategy, the following questions are common:
- What’s the ideal word count of content?
- Does the number of images per article invite people to scroll?
- Does title length play a role in search results?
How do you find the answers to these questions?
GA seems unlikely as it provides unrelated data points based on individual pages, right?
Only if you let it.
It’s entirely possible to rearrange data according to content groupings. This option lets you analyze your entire website’s content using the following data points.
- Article name
- Author
- Date published
- Number of words
- Title length
Let’s say you decide to look at data using number of words, title length, and date published to uncover what defines successful content.
This is how content would fit under your groupings:
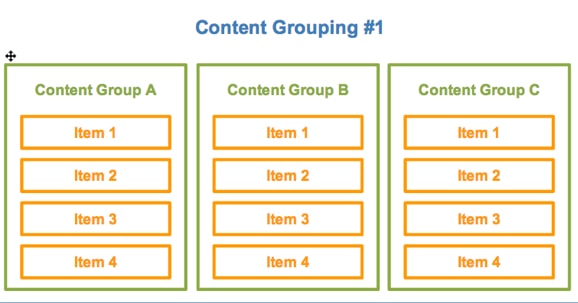
If you wish to segment content using more options, you can create an additional 20 custom groupings to segment content with.
For example, let’s say you’re interested in the impact of number of images per post.
Just enter your custom code into Google Tag Manager (more on that later) and GA will start grouping accordingly.

Once setup, your Google Analytics may look something like this.
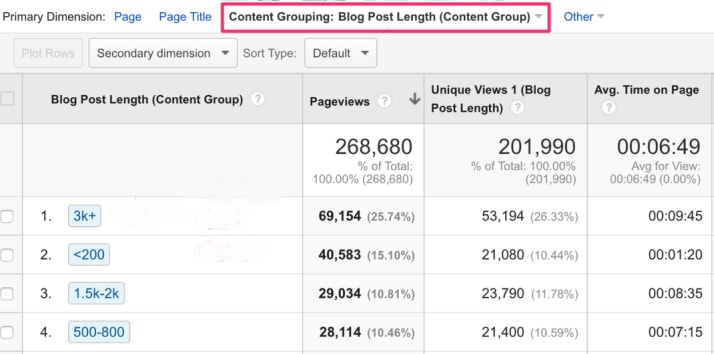
As you go through the data here, look for patterns.
In the example above, we can clearly see that blog posts longer than 200 words bring in a lot of traffic but not always offer the most value.
Use this insight to mend your plan of attack.
Ultimately, customization like this is important if we want to find answers to questions that accurately reflect our business.
Delve Deeper With Help From Google Tag Manager
In the previous section, I talked about simple customization as a mean to yield answers.
Customization is just the tip of the iceberg.
With help from Google Tag Manager (GTM), we can go even more in-depth and track user behavior (like how much a user scrolls before going ‘cold’) on your page.
What is GTM?
Launched in 2012, GTM is tag management tool.
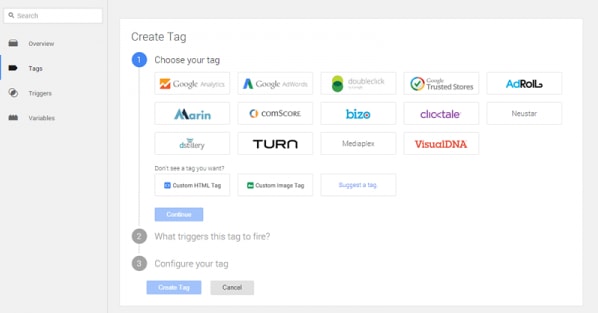
Tags are snippets of Javascript code that measure traffic and visitor behavior.
In fact, even Google Analytics is just a tag that’s hardcoded onto each page of your site that you wish to collect data from.
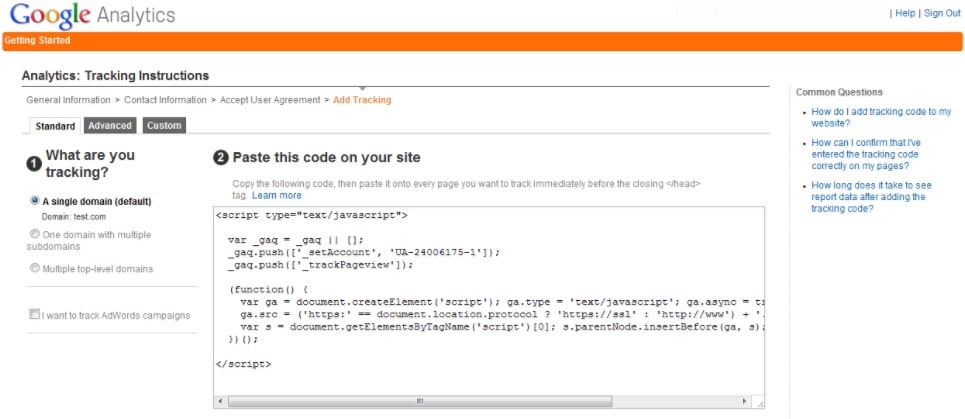
Unfortunately, maintaining GA code on large sites with multiple pages is a nightmare.
You’ll need to a developer to make changes manually every time you want something changed. This creates an unnecessary lag period between experimentation and implementation.
GTM streamlines this process by making it incredibly easy to create and manage tags deployed on a page without having to manually change site code.
How?
Just add the GTM snippet code (also known as container code) onto all relevant pages.
With that complete, all future edits, modifications, and changes can be easily deployed through GTM.
The process is simple and can be carried out by anyone.
Just as a reminder, GTM tags can run on platforms other than Google Analytics.
Here are a few other places you can utilize your GTM tags:
- Google Ads
- Facebook pixel
Think of GTM as a middleman.
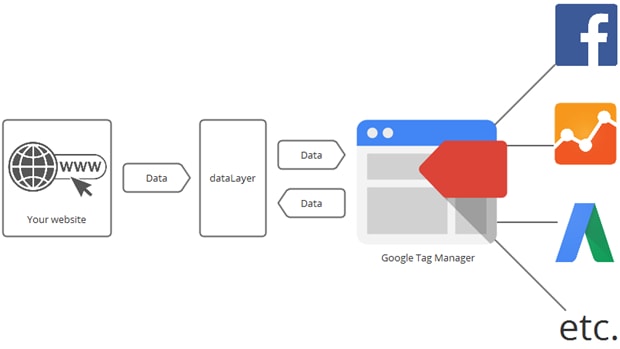
It acts as a silent observer until users carry out a specific action (trigger), at which point the data is relayed to Google Analytics.
This could be anything from clicking on the shopping cart, downloading a file, or playing a video.
Ultimately, this enables you to track some really interesting stuff (more on this in a bit).
In summary, here are the benefits of GTM:
- Simplifies deployment and creation of scripts
- Facilitates interaction between marketing and IT
- Allows you to spend more time analyzing instead of implementing
Create a Revamped Dashboard With GTM
Coming back to your content strategy, data like pageviews and time on page is not that useful.
As we’ve seen, these values are calculated arbitrarily and don’t reflect reality.
GTM allows for endless possibilities, which means you can flex your creative (and technical) muscle by creating custom scripts.
Here are just a few things you can measure:
- SERP bounce rate
- Scroll depth rate or read rate
- Interactive time on page
We’ve done the hard work for you and put together the formulas you’ll need to get these custom Google Tag Manager scripts. We’ll email them to you!
With this data, you’ll be able to answer questions like how many people opened your articles and how they interacted with it (for example, scroll depth).
Let’s take a look at each of the above examples more in-depth:
SERP bounce rate
Look up bounce rate online and you’ll realize its perceived importance in rankings.
Let me say this now – Google isn’t looking at your GA bounce rate data as part of its ranking algorithm.
This data can be easily manipulated and Google is smarter than this.
What Google is interested in is the SERP bounce rate.
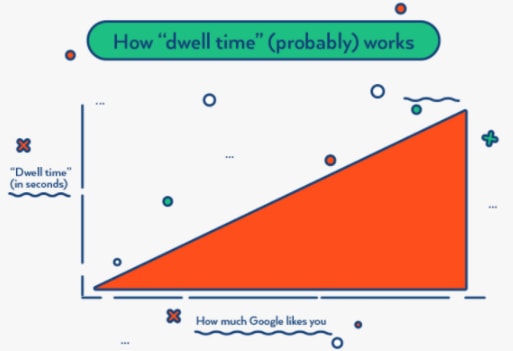
This is the measurement of time elapsed between when a user lands on your site from a SERP page until they return (also known as dwell time).
The notion is that the longer a user stays on your page, the more valuable it is and hence the page should be ranked higher.
How is this information useful?
If you’re worried about the quality of a post for a certain keyword or landing page, SERP bounce rate will help you determine the page’s true value.
Interactive time on page
GA’s average time on page metric is meant to show how long visitors spend on a page.
Yet, it’s measured by looking at time elapsed between two page views.
Again, we have to ask: What’s the problem in this approach?
Let’s say you land on a page, decide to go to the movies and have dinner. Your time on page will keep ticking until you visit another page.
You don’t even need to have the page open in your browser.
This begs the question, how much time is a user actually spending interacting with your page (whether it’s scrolling or clicking) instead of idling on it?
The longer someone scrolls or clicks around, the easier it is to convince them on your offer.
For this reason, it’s better to have a script detect inactivity after a user stops scrolling or clicking around on page (with some time delay of course).
When time on page vs interactive time on page data is compared side by side, we can clearly see the inaccuracy of GA.

On average, GA reports visitors spending 7x more time on your page than they really do.
For content planning purposes, such inaccuracy can lead you down the wrong road.
Yet, interactive time on page provides insight into how users are digesting your page. Are they reading through the content or abandoning after a few lines?
Many marketers relying on Google Analytics look at page views and average time on page data to measure a campaign’s success.
This is one reason why you see so much clickbait content.
A flashy title may bring in a large number of visitors but if the content on the page doesn’t match with what the visitor expects to see, they won’t stay on your page long.
This type of page is significantly less valuable than a page that brings visitors and keeps them engaged (reading, scrolling, clicking).
Turn content into e-commerce products
GA has a robust ecommerce measurement system known as Enhanced Ecommerce.
It helps you visualize the movement of your products down the purchase funnel. Naturally, you can customize these funnels.
Instead of adding e-commerce products as you normally would, add your content to the Enhanced E-commerce tool.
This helps you answer questions like:
- Read rate (how many people opened the article or ‘purchased it’)
- Scroll-depth (how many people scrolled 1/3rd vs 2/3rd of the article)
This provides yet more insight as to how people actually interact with your content.
This is a bit more experimental, so spend time setting up and defining the parameter of your funnels. Every movement down the funnel should answer a fundamental question.
Keep in mind your end goal for the page (click-through to a product page? Getting an email address in exchange for a lead magnet?) and use the Enhanced E-commerce tool to measure which pages (and the factors on those pages that) best lead the visitor to that end result.
Conclusion
Out-of-the-box, Google Analytics is by no means a lightweight.
You can use it to immediately uncover insights and make informed decisions.
Yet, to get the data you need to make informed marketing decisions, you have to make the tool work for you.
For far too long marketers have relied on Google Analytics default settings.
With a little work, you can customize Google Analytics to give you more valuable and relevant data.
